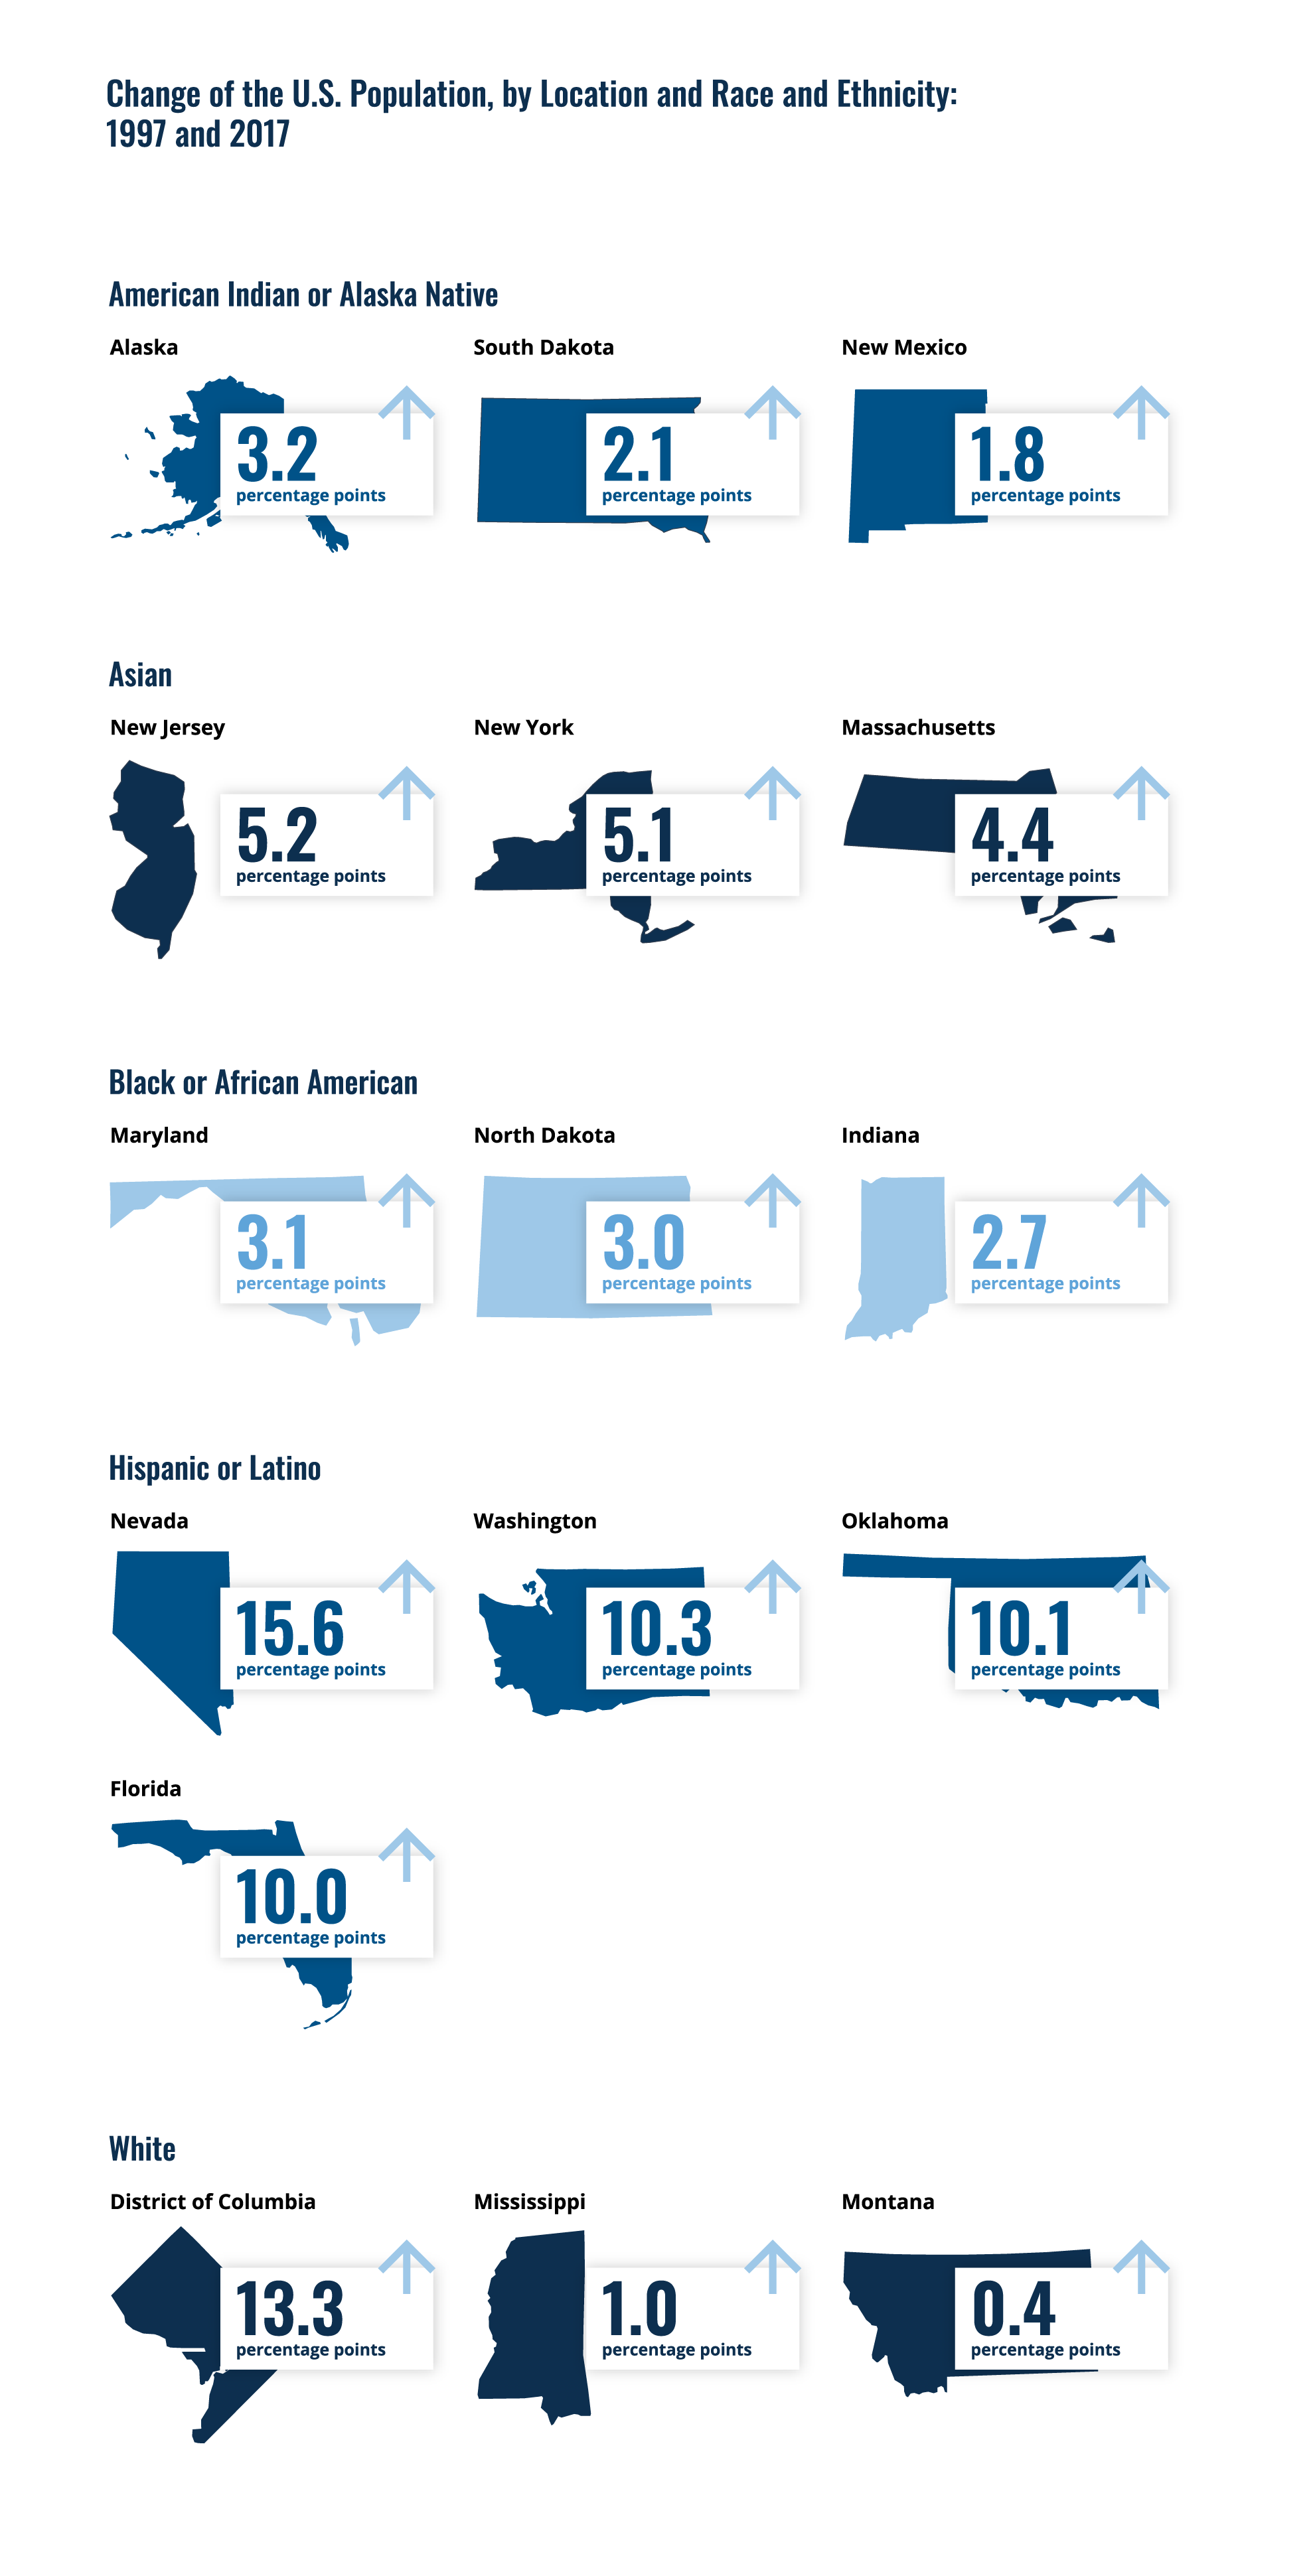
Where Populations Are Growing
The U.S. population as a whole experienced great racial and ethnic demographic changes between 2002 and 2022. The overall share of the population who identified as White decreased, and the share of those who identified as people of color increased. Comparing the distribution of racial and ethnic groups in each state and the District of Columbia from 2002 and 2022 shows how each state has experienced demographic changes. [1]


Report Links
Race and Ethnicity in Higher Education: 2024 Status Report
Chapter One: Population Trends and Educational Attainment
Chapter One Report Download (PDF) 812 KB
Chapter One Data Tables Download (XLSX) 144 KB
Source
U.S. Census Bureau, Current Population Survey, 2002 and 2022
Data Notes
In 2002, the only reported racial demographic categories were Hispanic; White; Black; American Indian, Eskimo, or Aleut; and Asian or Pacific Islander.
[1] “Native Hawaiian or other Pacific Islander” and “more than one race” were not official classifications until 2003. As a result, a 20-year comparison is not possible.
