By Morgan Taylor and Jonathan M. Turk
Introduction
As the United States has become more racially and ethnically diverse over the past several decades, so too has higher education. More students of color are seeking a postsecondary credential than ever before. The increase in access for students of color has led to higher levels of educational attainment and the opportunity for upward socioeconomic mobility for a more diverse student population.
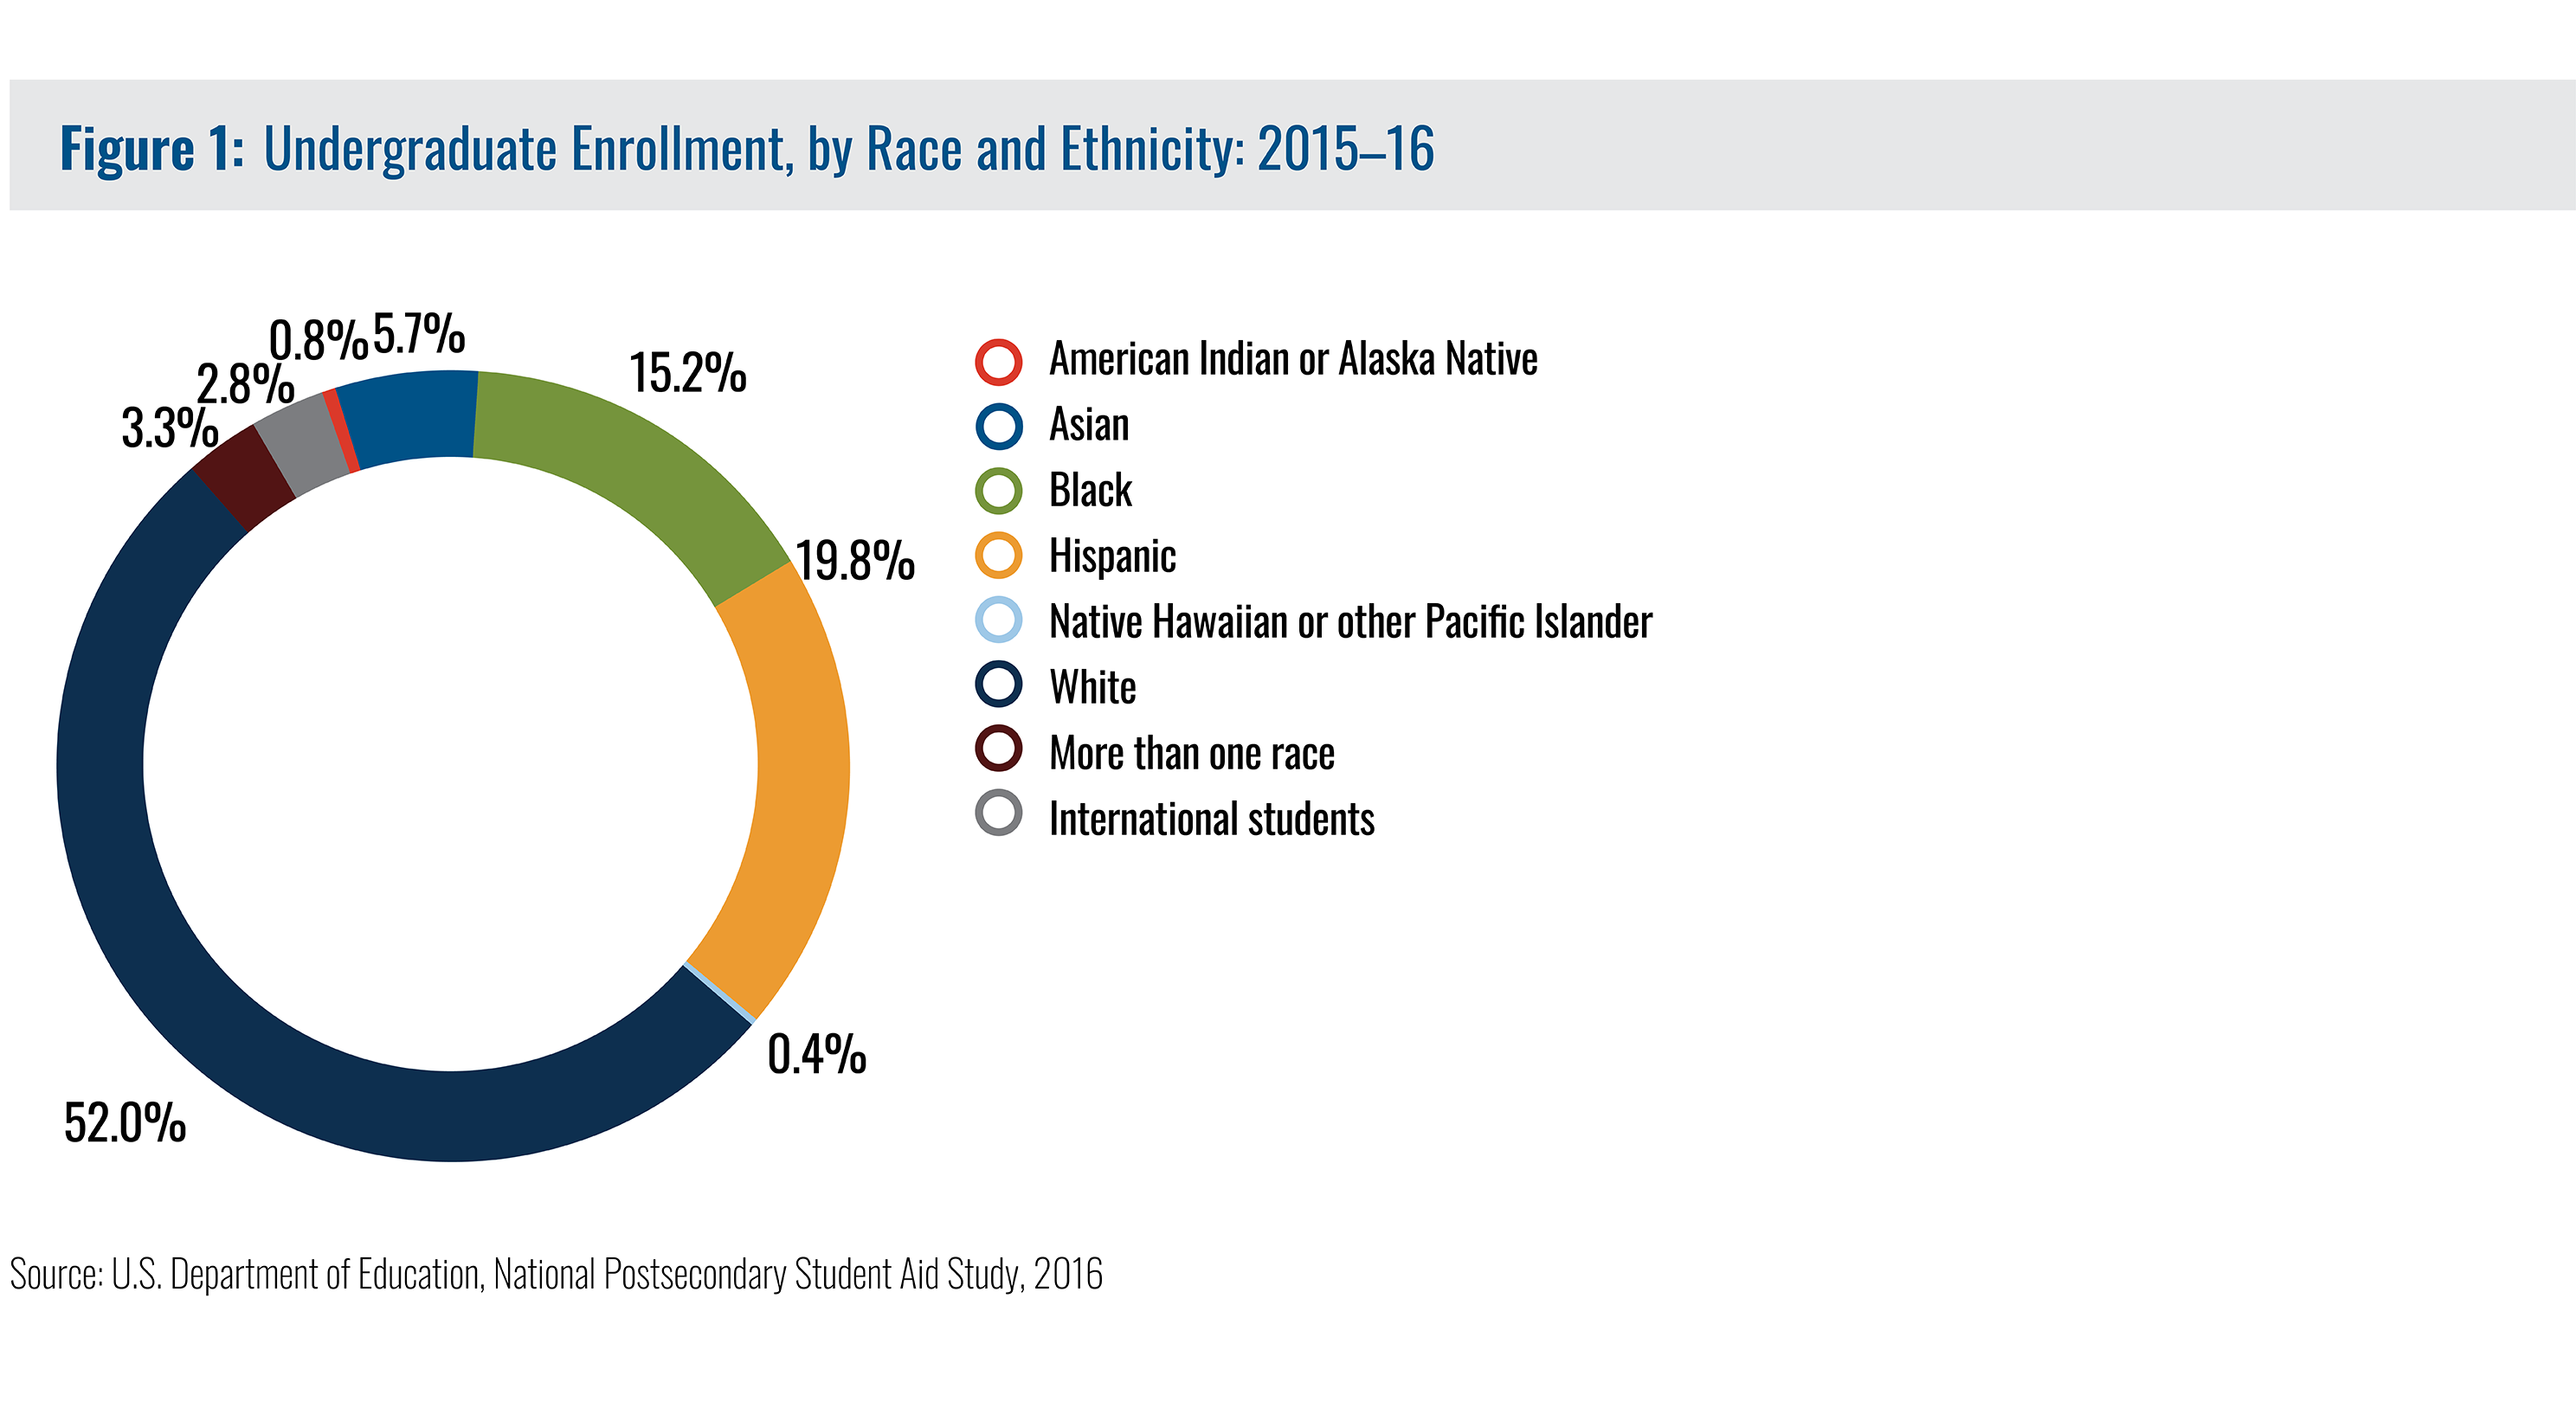
However, the educational journeys of today’s students vary greatly by race and ethnicity. In 2015–16, 45.2 percent of all undergraduates identified as a racial or ethnic group other than White. Overall, students of color—particularly Black students[1]—had lower persistence rates and completion rates, higher debt burdens, and lower median annual earnings than their White peers (Espinosa et al. 2019).
Many equity gaps remain, including among students with the most financial need. This brief examines student income alongside race and ethnicity, analyzing data from the National Postsecondary Student Aid Study 2015–16 to provide an overview of low-income undergraduate students, who they are, where they enroll, and how they pay for college.
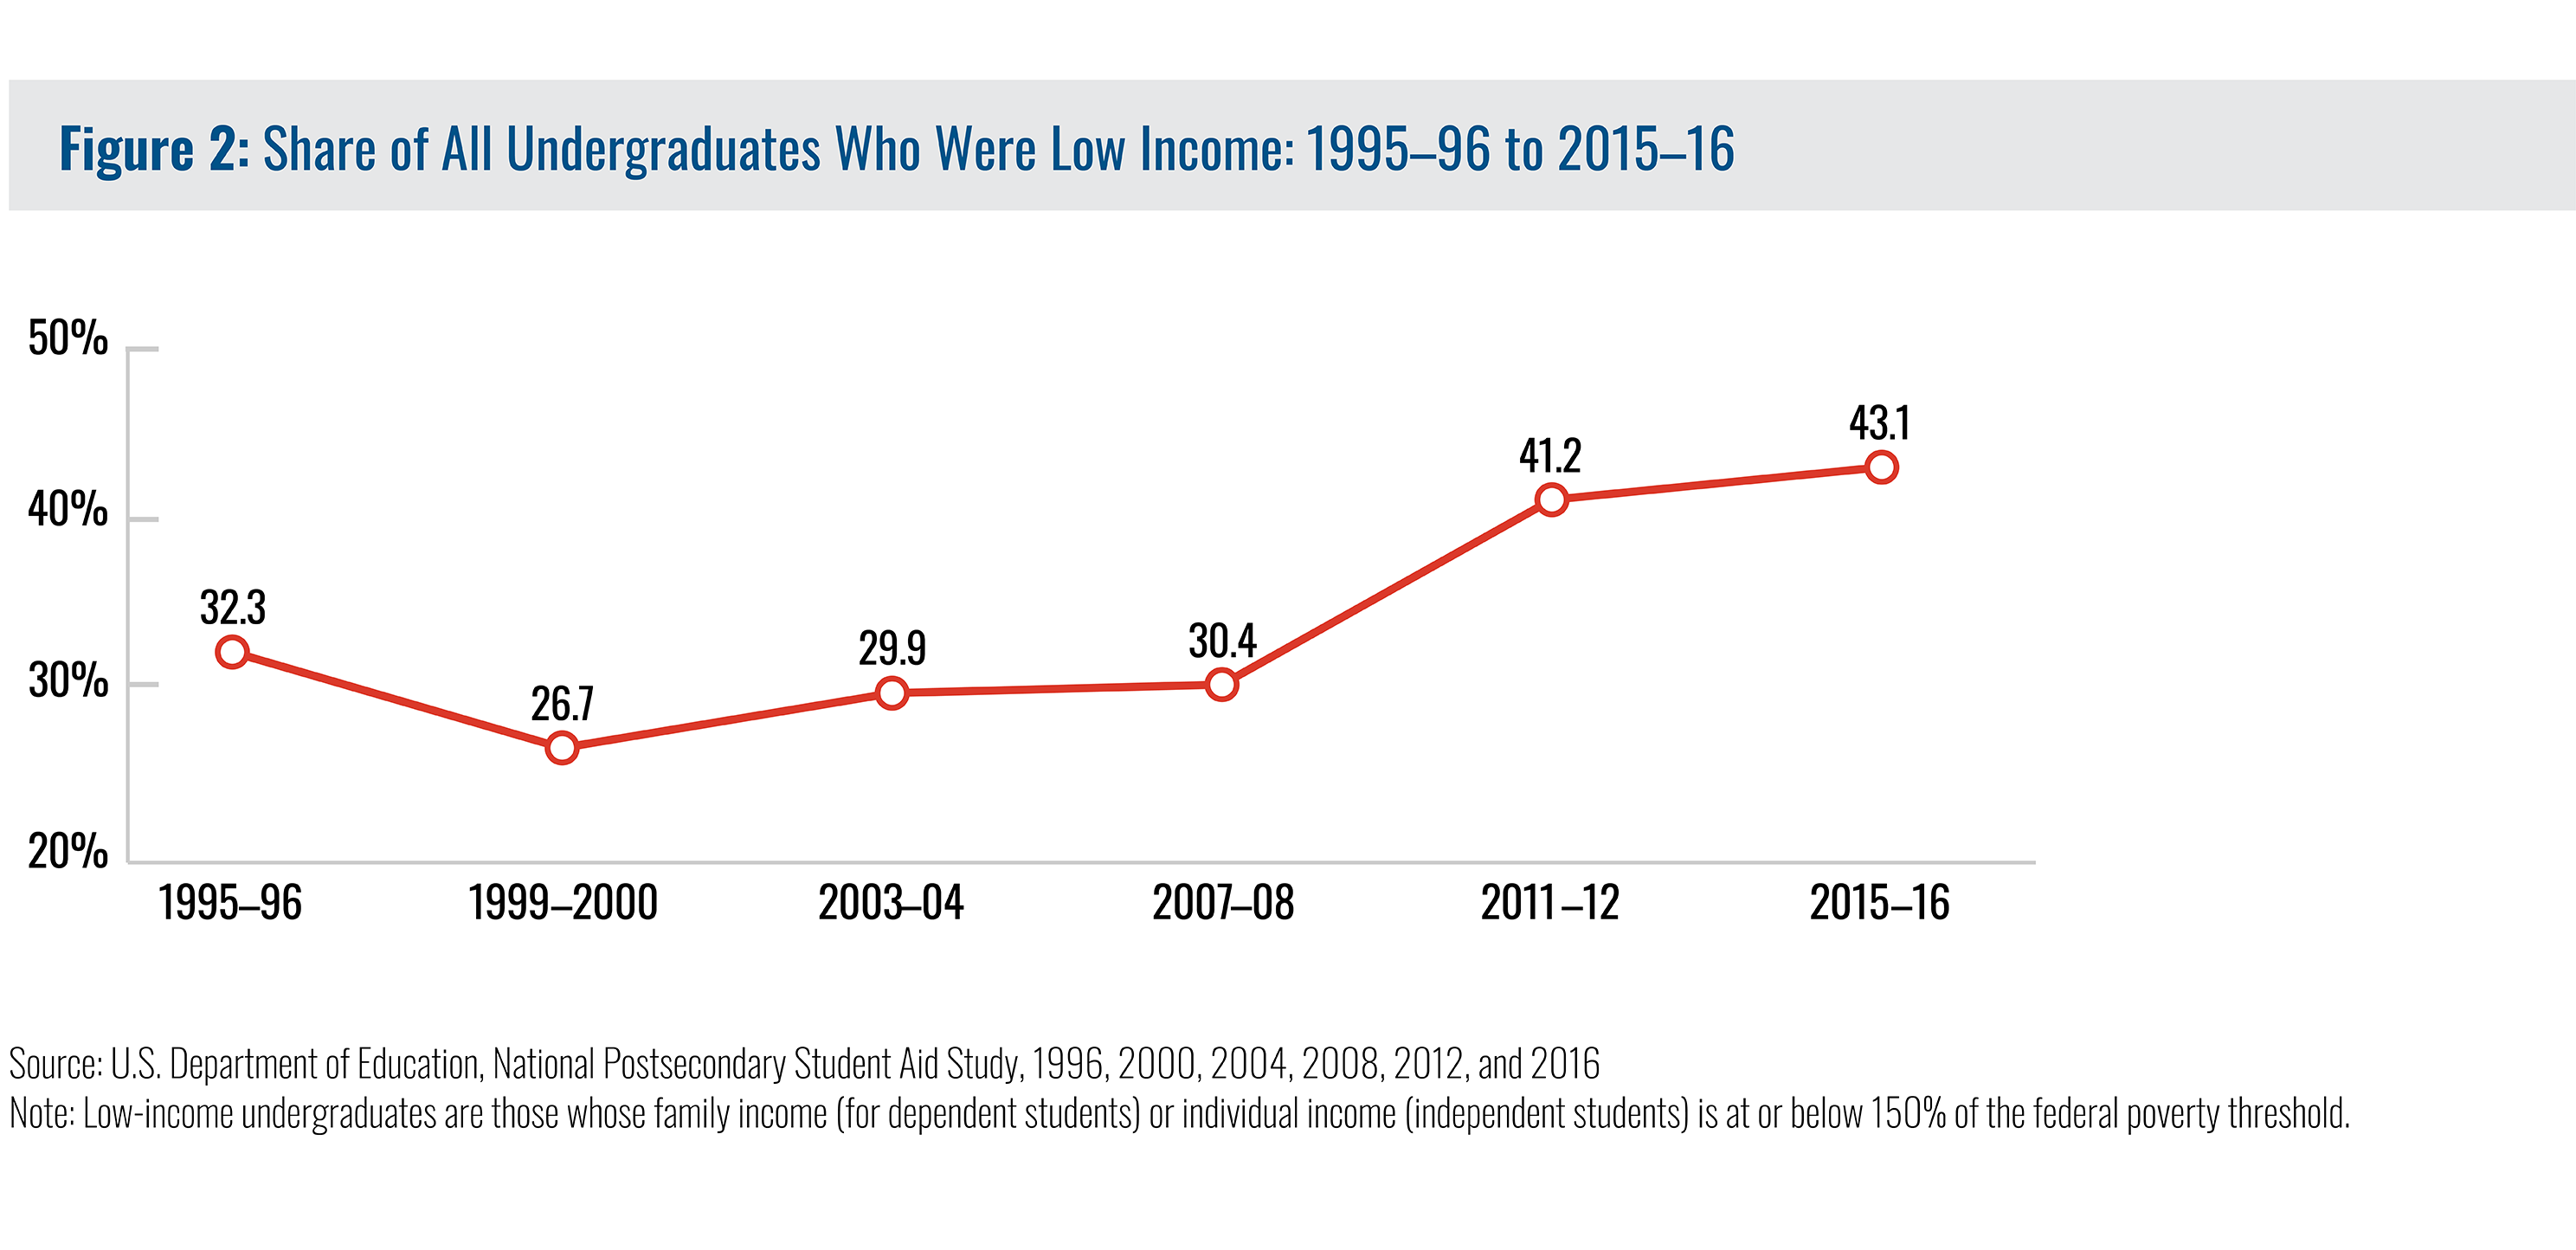
The federal government considers low-income students as those whose family income is at or below 150 percent of the federal poverty threshold.[2] In 2019, for a U.S. family of four, 150 percent of the federal poverty level was a household income of $38,625.[3] In 1996, the share of low-income students was 32.3 percent. From 2000 to 2016, the share of low-income students increased from 26.7 percent to 43.1 percent.
Download and Read the Full Brief (PDF) 1.6MB
[1] The terms Black and African American are used interchangeably.
[2] The federal poverty guidelines are published annually by the U.S. Department of Health and Human Services (HHS). The U.S. Department of Education uses these guidelines for federal outreach and student services programs for low-income students. For more information, please visit https://www2.ed.gov/about/offices/list/ope/trio/index.html.
[3] This number reflects the household income among those living in the 48 contiguous states, Washington, DC, and outlying jurisdictions. For more information, including income for individuals living in Alaska and Hawaii, please visit https://aspe.hhs.gov/poverty-guidelines.
